Pandas timeseries plot - setting x-axis major and minor ticks and labels
I’ve asked this question on StackOverflow (http://stackoverflow.com/questions/12945971/pandas-timeseries-plot-setting-x-axis-major-and-minor-ticks-and-labels), but couldn’t include images because I haven’t posted on stackOverflow before. So here it is, with the images.
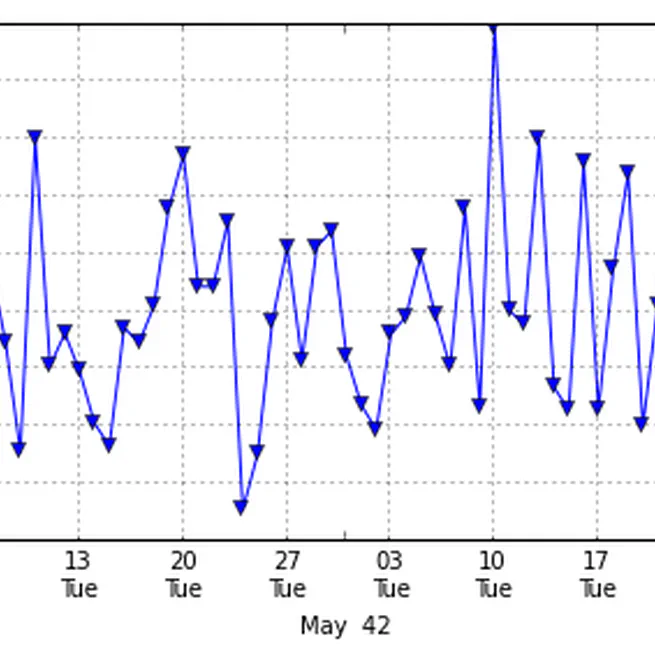
I want to be able to set the major and minor xticks and their labels for a time series graph plotted from a Pandas time series object.
Oct 18, 2012