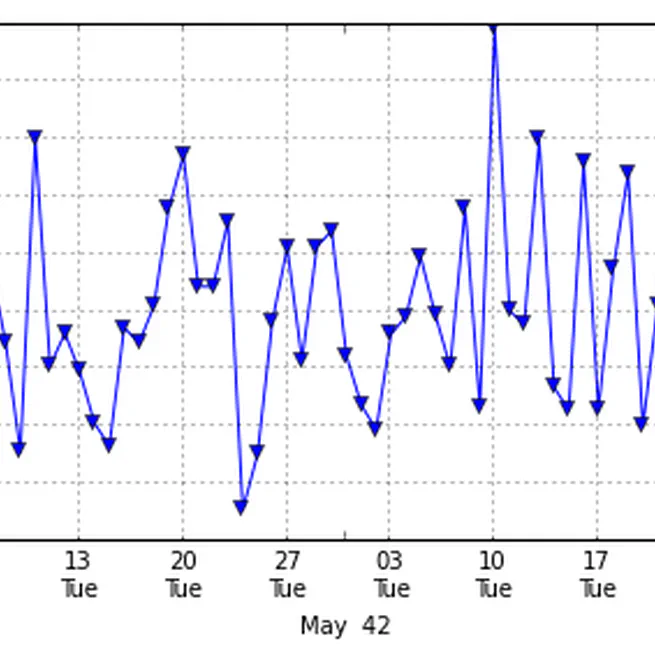
Pandas timeseries plot - setting x-axis major and minor ticks and labels
I’ve asked this question on StackOverflow (http://stackoverflow.com/questions/12945971/pandas-timeseries-plot-setting-x-axis-major-and-minor-ticks-and-labels), but couldn’t include images because I haven’t posted on stackOverflow before. So here it is, with the images. I want to be able to set the major and minor xticks and their labels for a time series graph plotted from a Pandas time series object.
Oct 18, 2012

Experimenting with MSAFluid library
I’ve been trying out the MSAFluid library by Memo Akten for Processing. Starting from the example program that comes with the library, I’m making a wind tunnel. I’ve seperated adding force to the fluid, adding particles and adding dye so that I can add each where I want to.
Jun 8, 2009